

It's the RUINS fifth anniversary, but I'd rather talk about triangles
Today marks the fifth anniversary of the beginning of RUINS. Yes, I’ve been writing here for five years! I won’t bore you with a post full of personal recollections, “important takeaways from my experience,” “Things I learned,” or whatever. I find that kind of anniversary post boring in the extreme. Instead I want to talk about a tool I’ve found myself using, throughout my adult life, to help myself make sense of the relationships between concepts: the humble triangle.
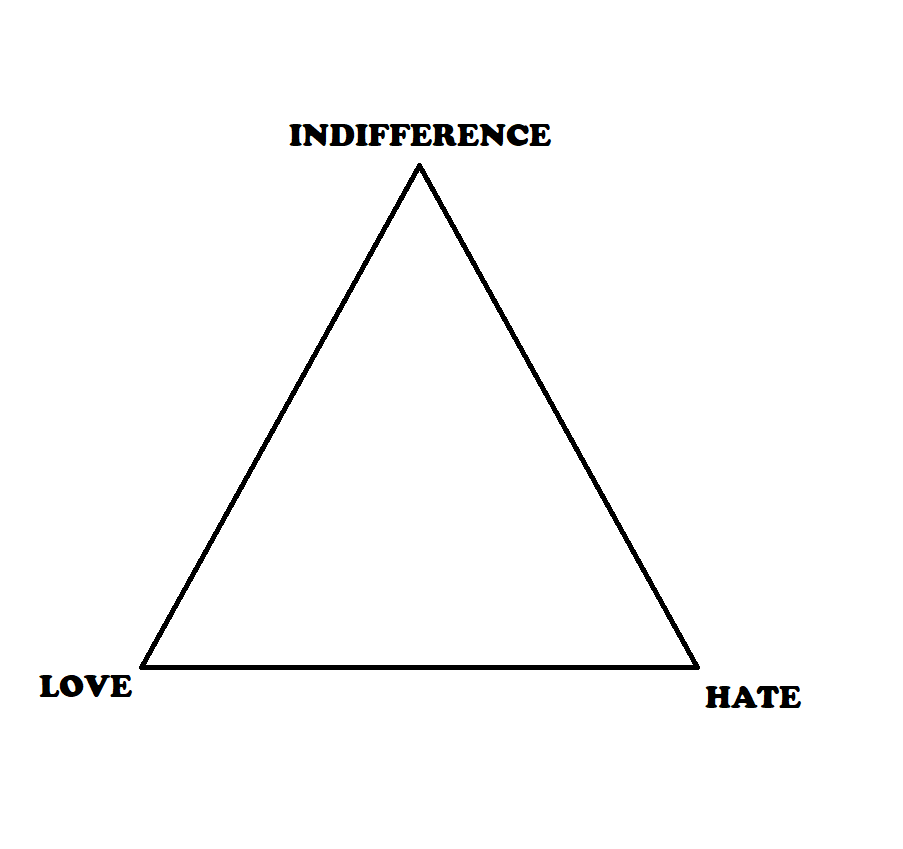
The first time I remember arranging ideas in a triangular fashion was when I was in my early twenties reading Dostoevsky. I noticed that he rather frequently seemed to equate the ideas of love and hate, and as I pondered why, it occurred to me that the opposite of love is not hate—it is indifference. Or, more accurately: love has two opposites. How is that possible? Can an idea really have two opposites? When I drew a triangle with the words love, hate, and indifference at the vertices, it all suddenly made sense:
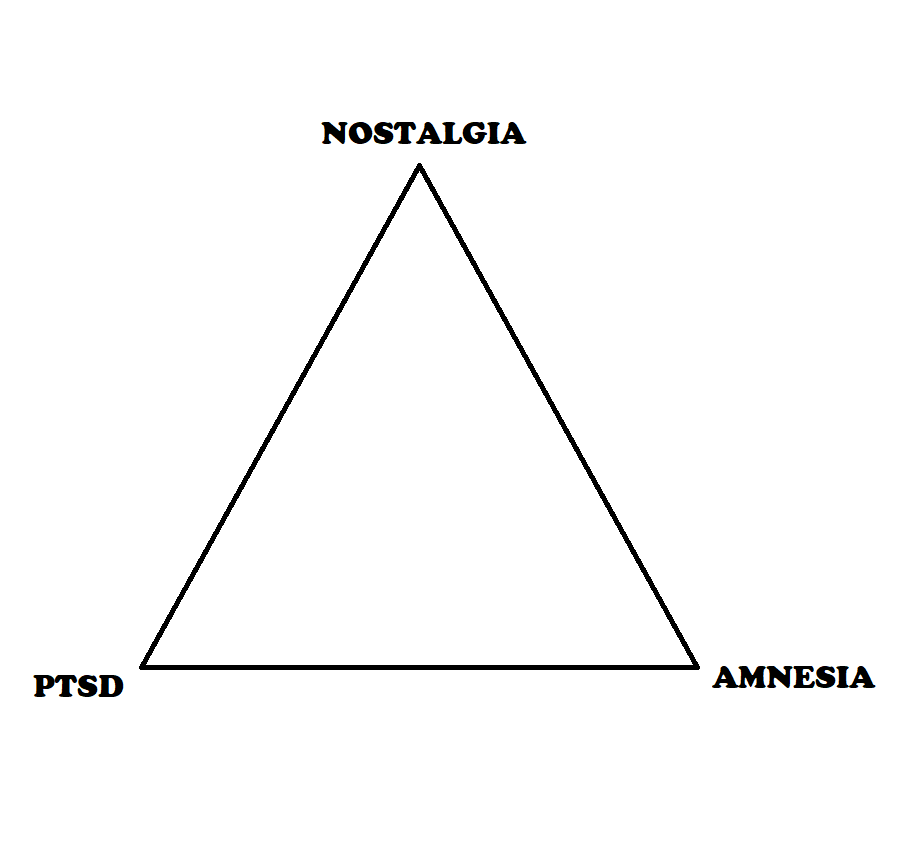
Since then I’ve used triangles to arrange my thoughts on the relationships between all sorts of ideas. The habit became more frequent as I started writing this blog. Here are a few others:
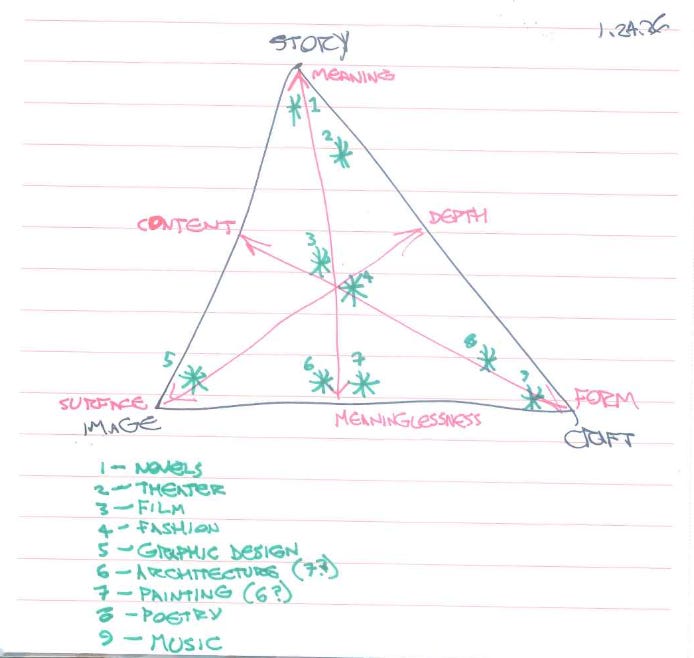
Eventually I began to use the triangles as a sort of three-dimensional cartesian graph. I can plot various items along three different axes when I use a triangle diagram. Perhaps this is, in fact, a real kind of diagram or graph already; if it is, I discovered it independently and I’ve been having great success using it for my own purposes. Here is an example: a triangular plot of several artistic genres along vectors of form / content, surface / depth, and meaning / meaninglessness:
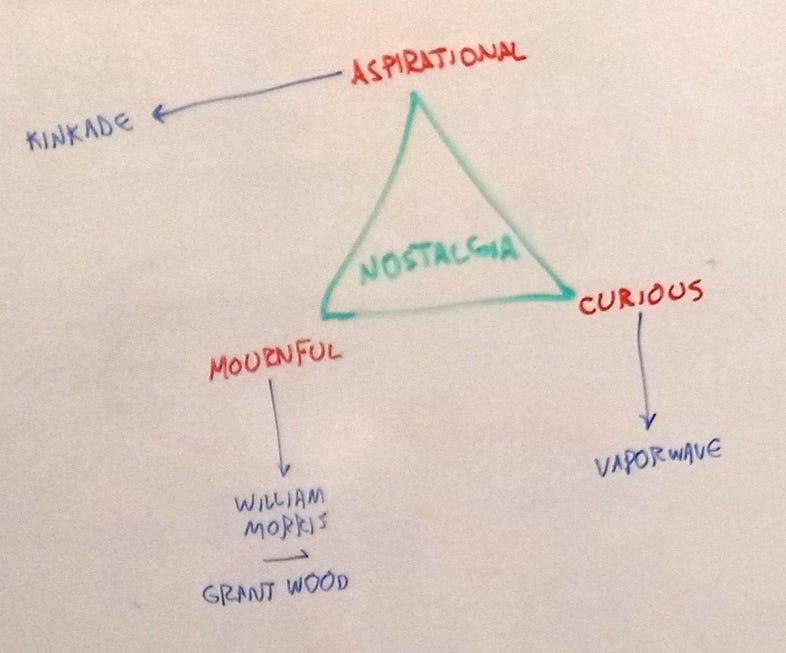
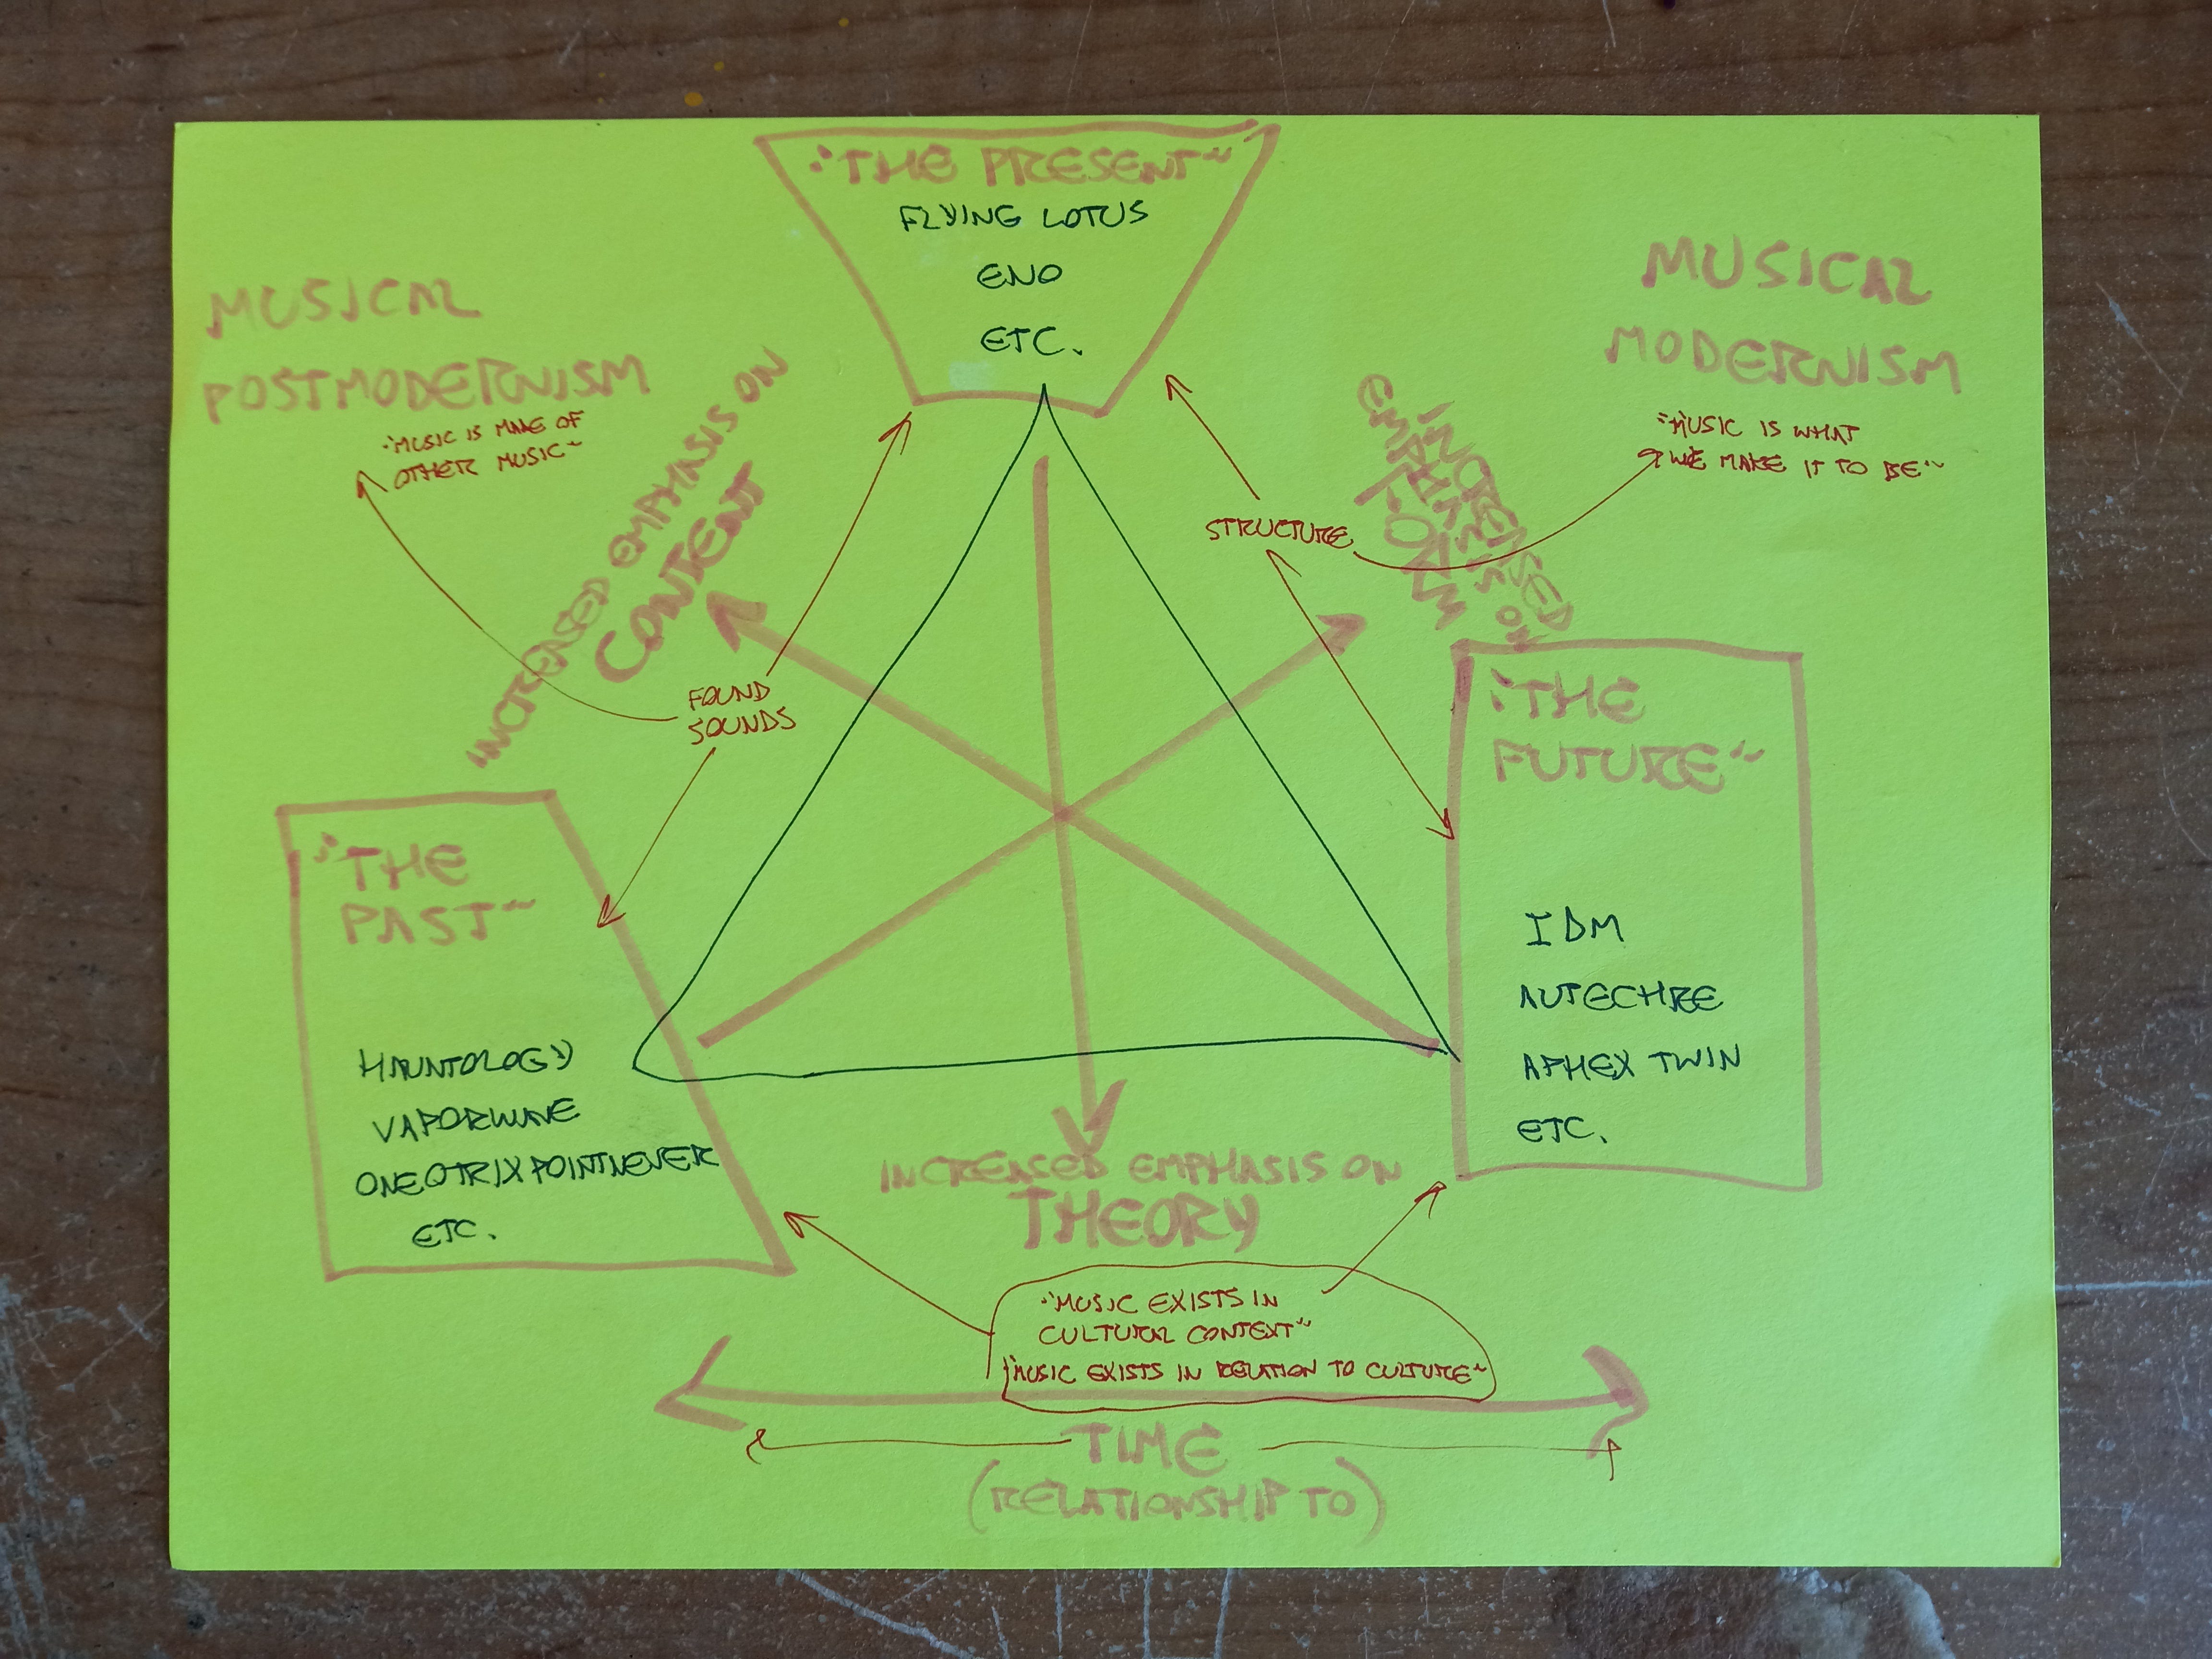
Here is a triangle-shaped attempt to define a brainstorm I recently had about different kinds of electronic music.
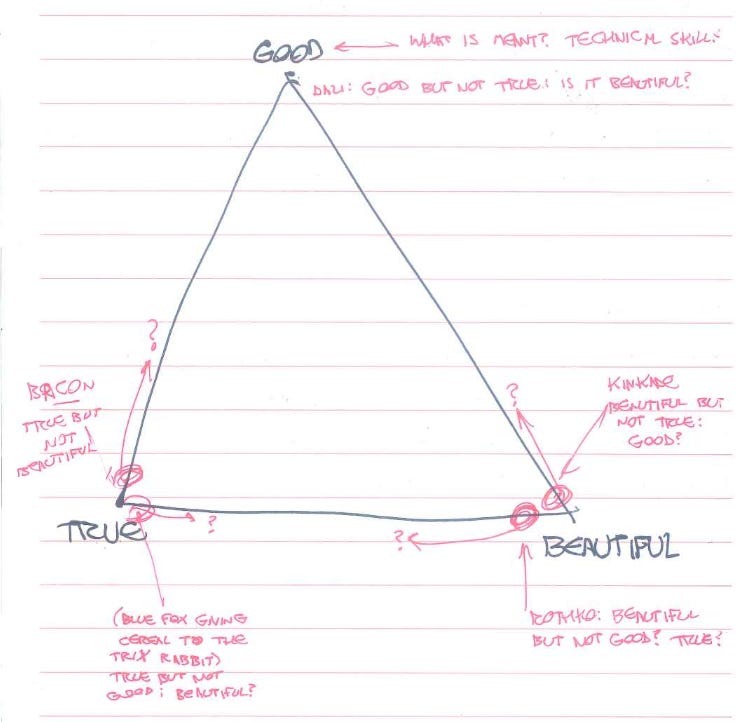
The below triangle attempts to explain how some artists’ works relate to the Three Transcendentals—you know, the ones Christian commenters on the arts love to invoke. It is incomplete; I couldn’t think of an artist whose work would go into the upper-left corner of the triangle and serve as an example of work which was good but not beautiful and possibly true. The reference to a “blue fox giving cereal to the Trix rabbit” refers to a work of furry fan art which Yakubian Ape used to illustrate his magisterial essay on the “Willy’s Chocolate Experience” debacle.
Occasionally I’ll make other kinds of diagrams. This essay about surrealism and romanticism is organized around a diagram of a river which I drew on the aforementioned employer-owned whiteboard but which I did not include in the essay itself. It can be easily recreated, though, by reading the essay with pen and paper handy and drawing as you read.
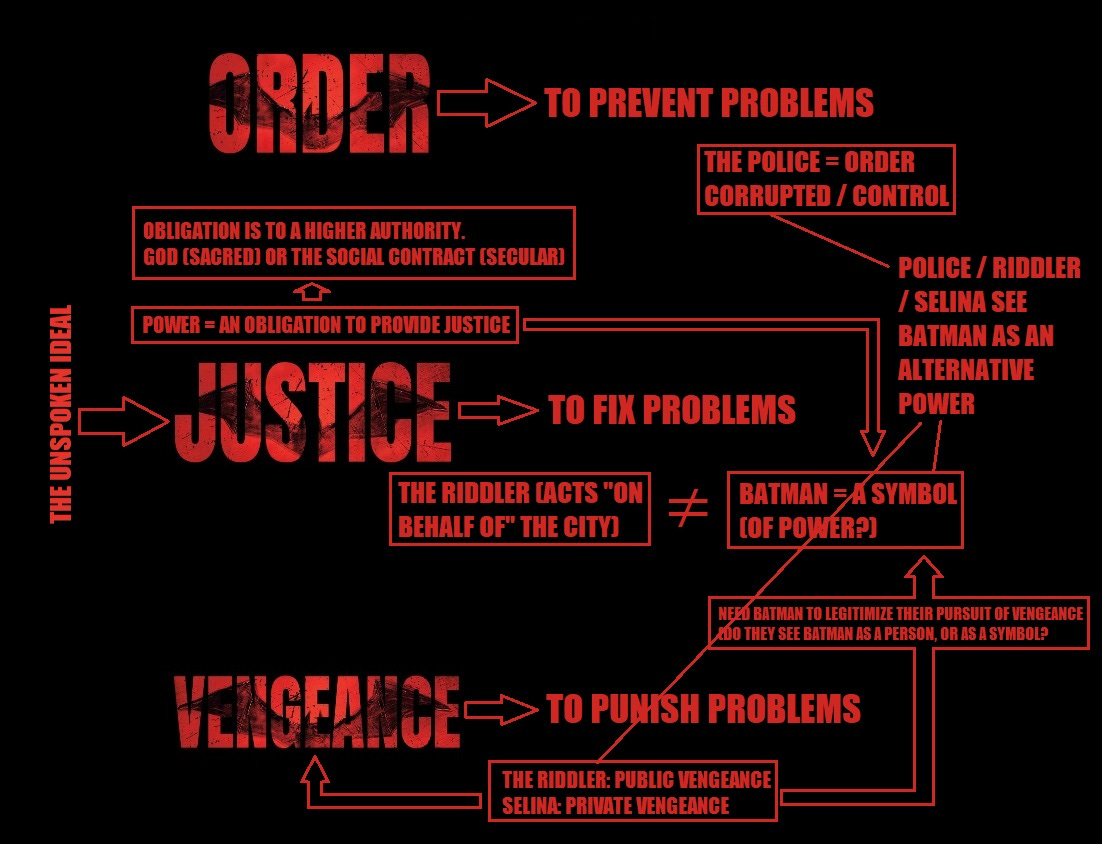
Does this count as a diagram? It’s a text-heavy illustration from my review of Matt Reeves’ Batman movie from 2022:
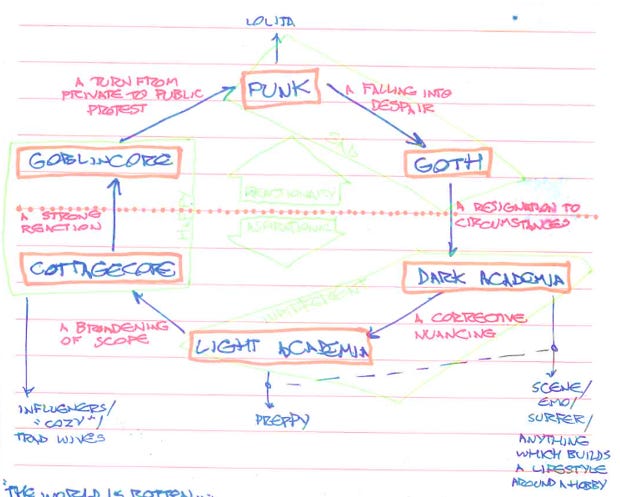
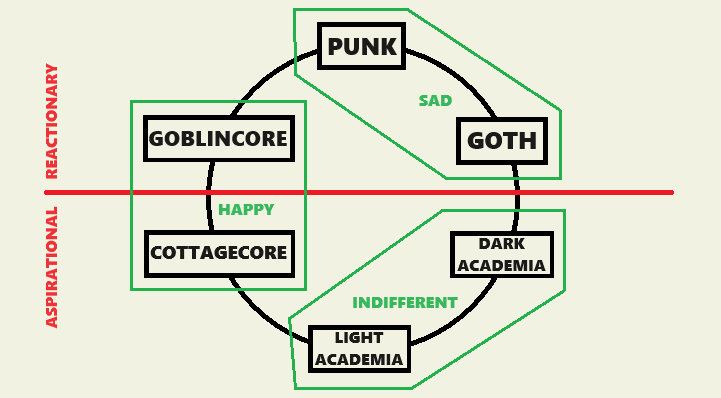
Probably the most complicated diagram I’ve ever drawn is this sort of benzene-ring-shaped thing. It developed into this essay about clothes (one of my favorite essays to write, by the way—looks like I did sneak in some anniversary-grade personal recollections). Below the hand-drawn version is the final version which appeared in the blog post.
And I don’t know if this counts as a diagram, but it feels like one to me. It’s my fancy way of saying these four verbs—reiterative, repetitive, recursive, and redundant—are related somehow: I put it at the start of this essay about the concept of Canon, in literature mostly but applicable to the other arts as well.

That’s all I’ve got for anniversary reflections. As always, feel free to get in touch, via Substack or other channels, if you want to talk about any of these diagrams, or if you want to share your own “graphic thought organizers” of any kind.
Congrats on 5 years! That might be a boring post to write, but it's well worth noting/celebrating.
Congrats on the five years!